

FII DII data today tracking built for informed market decisions
Tracking FII DII data today helps traders understand how institutional money flows influence market direction. Foreign and domestic institutions often drive momentum through large-volume trades. When traders analyse FII DII data today, they gain insight into whether markets are seeing accumulation, distribution, or cautious positioning. On Skytrade, this data is presented to help traders read sentiment, align trades with institutional behaviour, and avoid trading against strong market flows.
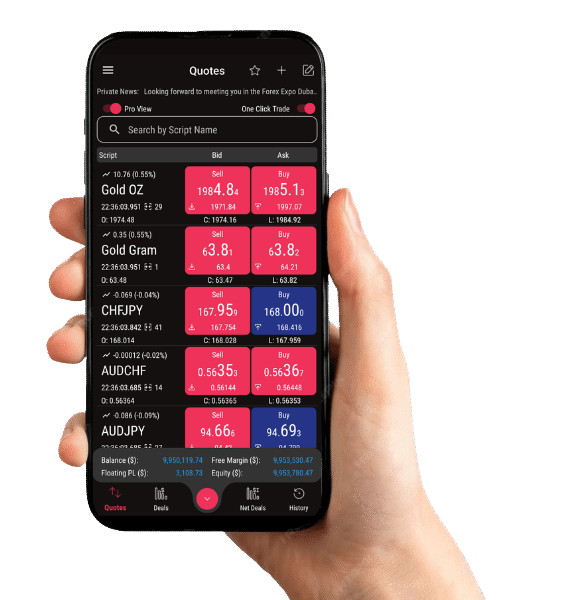


FII DII activity NSE revealing real market participation
Observing FII DII activity NSE allows traders to understand how institutions behave in the cash and derivatives segments. Changes in FII DII activity NSE signal shifts in trend strength or risk appetite. Consistent buying can support rallies, while sustained selling may indicate caution.
[expander_maker id=”1″ more=”Read more” less=”Read less”]
FII data today supporting short-term and positional analysis
Analysing FII data today helps traders gauge foreign investor confidence in the market. When FII data today shows strong buying, it often supports bullish momentum in index-heavy stocks. Traders who monitor this data daily can better manage entries and exits during volatile sessions.
FII net buying selling shaping market sentiment
Understanding FII net buying selling provides clarity on whether institutions are adding or reducing exposure. Positive FII net buying selling figures strengthen market sentiment, while negative numbers may increase volatility.
FII DII data India offering a broader institutional view
FII DII data India combines foreign and domestic participation to give traders a complete institutional picture. While FIIs influence global sentiment, DIIs often balance market stability. Analysing FII DII data India helps traders understand how both forces interact.
[/expander_maker]
Why choose Skytrade for tracking FII DII data
Clean institutional data view
Access FII and DII numbers in a clear, structured format that helps traders quickly interpret market sentiment without confusion.
Low Commission
Stay aligned with FII DII data today using regularly updated figures that reflect real institutional activity across trading sessions.
Actionable NSE-focused insights
Track FII DII activity NSE to understand how institutional participation impacts index movement and stock-level momentum.
Trend clarity beyond price charts
Use FII net buying selling data to confirm trends and avoid trades that go against dominant institutional flows.
Historical comparison for better judgment
Review FII DII historical data to compare current market behaviour with past accumulation and distribution phases.
Simple access for active traders
Skytrade presents FII DII data India in a trader-friendly format that supports intraday and positional decision-making.
FII DII historical data helping traders spot long-term patterns
Reviewing FII DII historical data allows traders to compare current flows with past market phases. Studying FII DII historical data helps identify accumulation zones, distribution phases, and trend reversals.
| GIFTNIFTY | ESCORTS | MARUTI |
| NIFTY | EXIDEIND | MCDOWELL_N |
| BANKNIFTY | EXIDEIND | MCDOWELL_N |
| BANKNIFTY | FEDERALBNK | MCX |
| AARTIIND | GAIL | METROPOLIS |
| ABB | GLENMARK | MFSL |
| ABCAPITAL | GMRINFRA | MGL |
| ABFRL | GNFC | MINDTREE |
| ACC | GODREJCP | MOTHERSON |
| ADANIENT | GODREJPROP | MPHASIS |
| ADANIPORTS | GRANULES | MRF |
| ALKEM | GRASIM | MUTHOOTFIN |
| AMBUJACEM | GSPL | NATIONALUM |
| APOLLOHOSP | GUJGASLTD | NAUKRI |
| APOLLOTYRE | HAL | NAVINFLUOR |
| ASHOKLEY | HAVELLS | NESTLEIND |
| ASIANPAINT | HCLTECH | NMDC |
| ASTRAL | HDFCAMC | NTPC |
| ATUL | HDFCBANK | OBEROIRLTY |
| AUBANK | HDFCLIFE | OFSS |
| AUROPHARMA | HEROMOTOCO | ONGC |
| AXISBANK | HINDALCO | PAGEIND |
| BAJAJ_AUTO | HINDCOPPER | PEL |
| BAJAJFINSV | HINDPETRO | PERSISTENT |
| BAJFINANCE | HINDUNILVR | PETRONET |
| BALKRISIND | IBULHSGFIN | PFC |
| BALRAMCHIN | ICICIBANK | PIDILITIND |
| BANDHANBNK | ICICIGI | PIIND |
| BANKBARODA | ICICIPRULI | PNB |
| BATAINDIA | IDEA | POLYCAB |
| BEL | IDFC | POWERGRID |
| BERGEPAINT | IDFCFIRSTB | PVRINOX |
| BHARATFORG | IEX | RAMCOCEM |
| BHARTIARTL | IGL | RBLBANK |
| BHEL | INDHOTEL | RECLTD |
| BIOCON | INDIACEM | RELIANCE |
| BOSCHLTD | INDIAMART | SAIL |
| BPCL | INDIGO | SBILIFE |
| BRITANNIA | INDUSINDBK | SBIN |
| BSOFT | INDUSTOWER | SHREECEM |
| CANBK | INFY | SIEMENS |
| CANFINHOME | IOC | SRF |
| CHAMBLFERT | IPCALAB | SUNPHARMA |
| CHOLAFIN | IRCTC | SUNTV |
| CIPLA | ITC | SYNGENE |
| COALINDIA | JINDALSTEL | TATACHEM |
| COFORGE | JKCEMENT | TATACOMM |
| COLPAL | JSWSTEEL | TATACONSUM |
| CONCOR | JUBLFOOD | TATAMOTORS |
| COROMANDEL | KOTAKBANK | TATAPOWER |
| CROMPTON | L_TFH | TATASTEEL |
| CUB | LALPATHLAB | TCS |
| CUMMINSIND | LAURUSLABS | TECHM |
| DABUR | LICHSGFIN | TITAN |
| DALBHARAT | LT | TORNTPHARM |
| DEEPAKNTR | LTIM | TRENT |
| DELTACORP | LTTS | TVSMOTOR |
| DIVISLAB | LUPIN | UBL |
| DIXON | M_M | ULTRACEMCO |
| DLF | M_MFIN | UPL |
| DRREDDY | MANAPPURAM | VEDL |
| EICHERMOT | MARICO | VOLTAS |
| WIPRO | ||
| ZEEL | ||
| ZYDUSLIFE |
| NIFTY |
| BANKNIFTY |
| FINNIFTY |
| MIDCAPNIFTY |
[table id=1 /]
[table id=2 /]
How Margin works?
100 shares of Reliance at 1250*
Other Broker
Rs 25000
Intraday Margin 500X
Rs. 250
Holding Margin 50X
Rs 25000
*Above values are for illustration purpose only, current market rates are applied while trading
Frequently Asked Questions
Why is FII DII data today important for active traders?
It helps traders understand institutional sentiment, market direction, and whether large participants are buying or selling.
How does FII DII activity NSE influence daily trading decisions?
It shows where institutions are active, helping traders align entries with real market participation.
What insight does FII net buying selling provide to traders?
It reveals whether institutions are increasing exposure or reducing risk across multiple sessions.
How is FII DII data India useful for overall market ana
It combines foreign and domestic flows to give a balanced view of institutional market behaviour.
Why should traders review FII DII historical data regularly?
Historical data helps compare current flows with past trends and improves long-term market understanding.